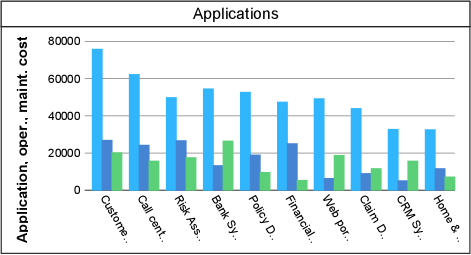
The value range shown on a chart axis is determined automatically based on the data of the selected dimension. For example, if the dimension is defined by a metric with enumeration values, the value range on the axis will run from the minimum to the maximum value of the enumeration value range. If a dimension has unlimited values, for example, money values or real values, then a proper value range for the axis is automatically determined, taking the values of the objects in the population into account.
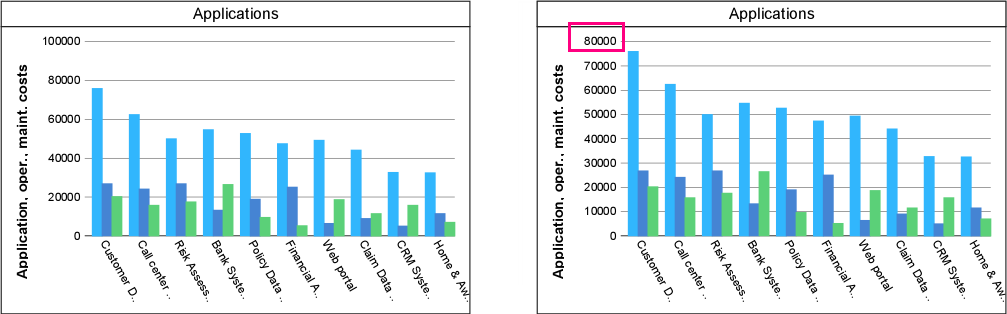
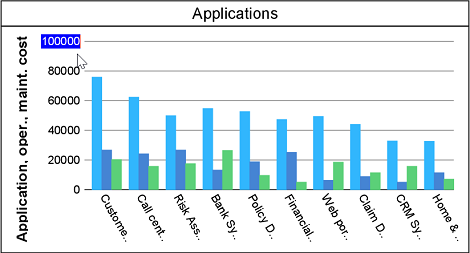
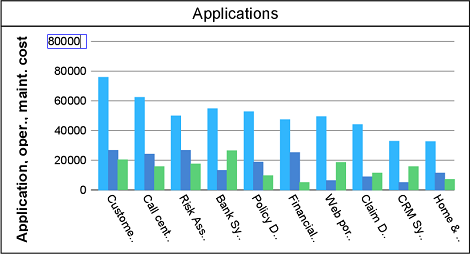
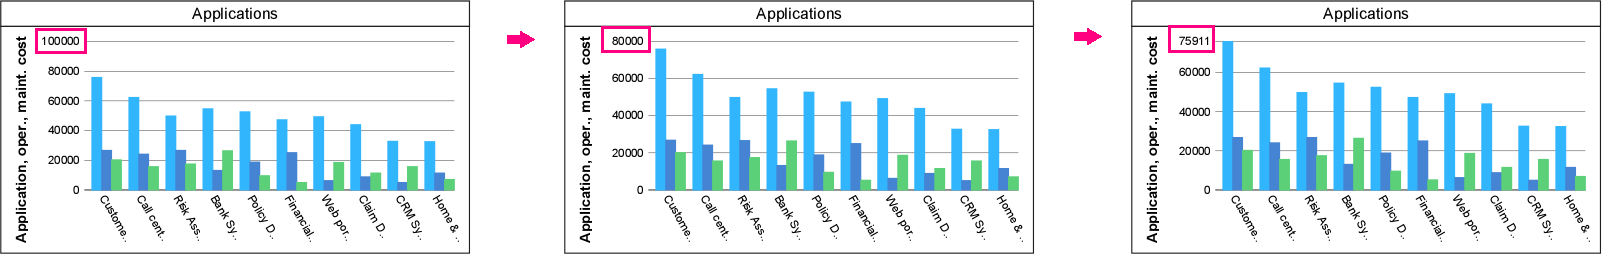
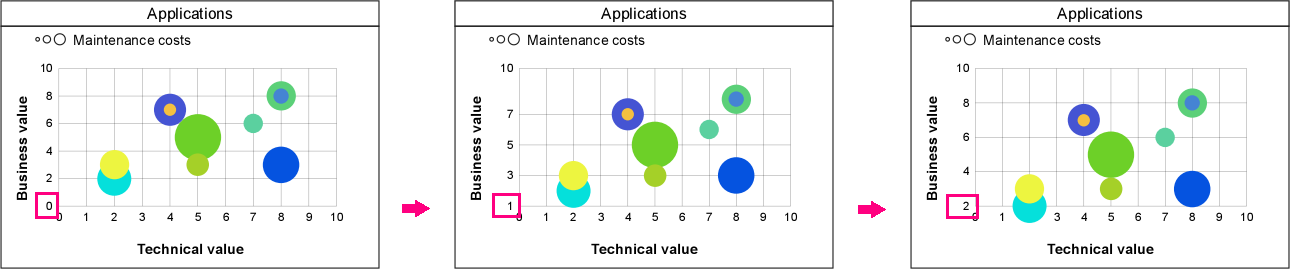
If you want to use a different value range on the axis instead of the automatically determined range, then you can manually adjust the minimum and/or maximum values on the axis. This is possible in a bar chart, bubble chart, line chart, and spider chart. It is shown in the examples below. In the bar chart, the maximum value has been set to a lower value that still covers the highest value of an object in the chart. In the spider chart, the maximum value has been adjusted so that its value equals the highest value of an object in the chart. In addition, a new minimum value has been set.
Initial value range y-axis (left) and adjusted maximum value (right)
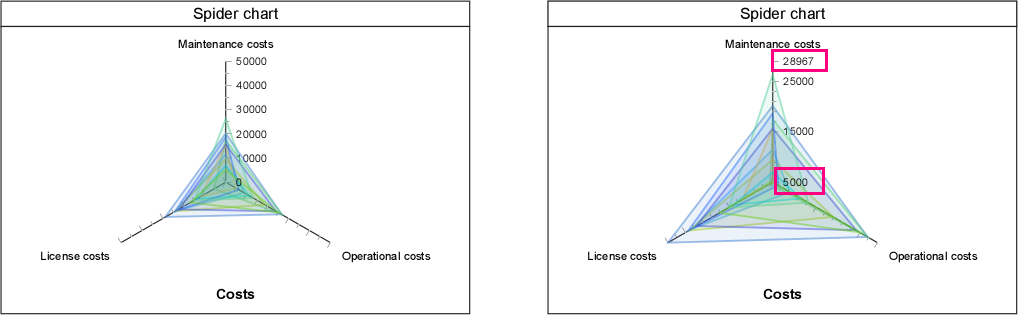
Initial value range (left) and adjusted minimum and maximum value (right)

|
The operation(s) can only be performed on charts in Enterprise Studio. When published in Horizzon, the charts are graphical representations. |
The value range of a bar chart, bubble chart, line chart, and spider chart can be changed by adjusting its maximum and/or minimum value on the axis.
The chart is automatically adjusted to the new value range:
Instead of manually setting a global maximum value you can also set the maximum value to exactly match the highest value of an object in the chart. Depending on the values used on the axis, the result can be a number that is not a pretty rounded number. Please take note that matching the maximum value is only possible if you have already manually set a maximum value. It does not work if the maximum value is the initial value generated by the chart.
Instead of manually setting a global minimum value you can also set the minimum value to exactly match the lowest value of an object in the chart. Depending on the values used on the axis, the result can be a number that is not a pretty rounded number. Please take note that matching the minimum value is only possible if you have already manually set a minimum value. It does not work if the minimum value is the initial value generated by the chart.
Matching the minimum axis value is only possible for the bubble chart and spider chart, it cannot be done for the bar chart and line chart.
If you want to restore the manually changed axis value(s) to their original value(s), do the following, regardless of which value(s) you have changed before:
The chart now automatically recalculates the original value range based on the chart data and shows it in the chart.