
View filters are a way to present models in a different way, for example, by using colors to emphasize certain aspects of the model. View filters are visualizations generated based on property or metric values of an object or relation in the site. Properties can be the object's or relation's own properties, but can also come from data blocks available on an object or relation.
A viewpoint is a saved or unsaved generated view filter. View filters in Horizzon can be generated on the following types of views:
In the case of ArchiMate views, specific view filters can also be generated via related objects and relations. These filters are based on the endpoint of a path in the object relations explorer of an ArchiMate object or relation.
On this page:
Horizzon supports creating viewpoints of the following view filters: color view, label view, tooltip view, highlight view, chart view, and table view. Below are some examples of different types of generated views. The availability of a view filter type on an object or relation depends on the data type of the selected property or metric. Chart views can only be generated on properties and metrics with type integer, real, or money values.
The highlight view is an indirect view filter; it can be activated on a generated color view.
When generating view filters based on an endpoint of a path in the object relations explorer in an ArchiMate view, only the color and label view are available.
Color view
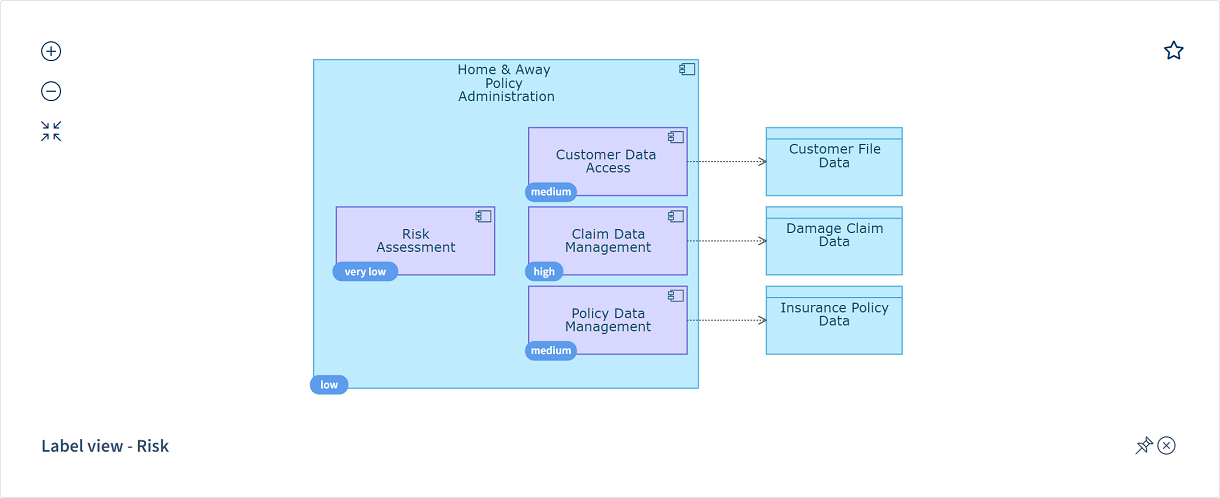
Label view

Tooltip view

Highlight view

Combined color, label, and highlight view

Pie chart view

Table view
View filters can be generated based on property and metric values of an object or relation, or on the endpoint of a path in the relations explorer of an object or relation. The latter only applies to ArchiMate objects and relations and only supports color and label views.
To generate a view filter, follow these steps:
 and select the view filter of your choice.
 next to the endpoint, and select the view filter of your choice. You can go up to 3 levels of relations to generate a view filter.
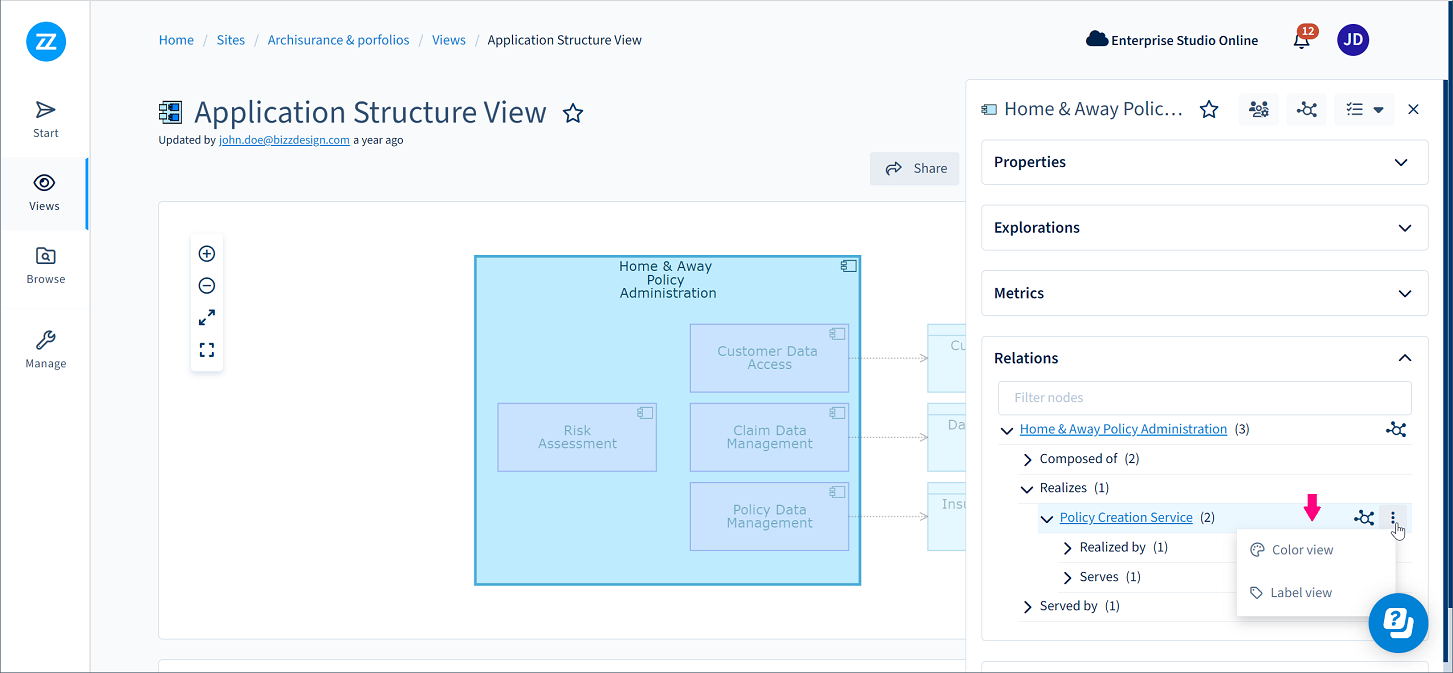
The view filter is generated and applied to the view. Example:

To delete a generated view, click the  in the lower right corner of the view. To save the generated view as a viewpoint, click the
  .
.
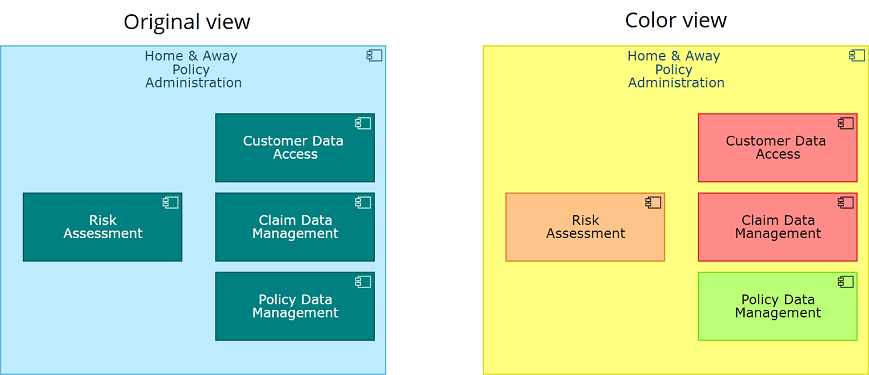
If text colors in the original view would result in a less readable color view, the text color will automatically be adjusted in the color view to keep it readable at all times. An example is shown below. The light text in the objects in the original view (left) is automatically adjusted to a dark color in the color view (right) to provide a good contrast with the background.
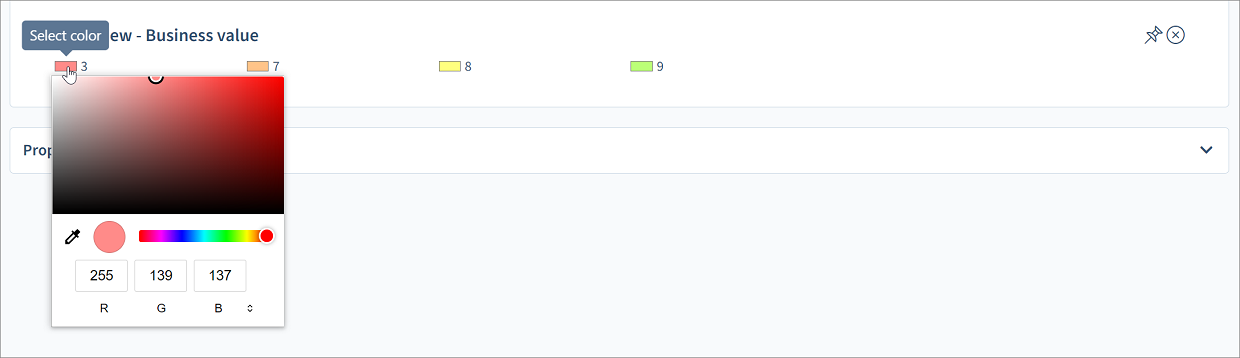
The values in a generated color view are sorted from low to high for numbers. Enumeration values are sorted by their literals. The colors in the color view are used accordingly. If you prefer to use colors other than the automatically chosen ones, you can customize them. To do this, click a color in the legend, then select a new color from the color scheme or enter a color code. By clicking the ![]() at the bottom of the color selection window, you can switch color code type (RGB, HSL, HEX).
at the bottom of the color selection window, you can switch color code type (RGB, HSL, HEX).
A highlight view can be generated on a color view. To generate a highlight view, click one of the legend values in the color view. The selected color will be highlighted in the view. If you click the color box associated with the value, you can change the value color.

It is possible to combine multiple view filter types in a single view. After you generate the first, generate another. The results will be added to the existing view.
A chart view shows the values of selected properties and metrics for all objects and relations in the active view.

|
The chart view is available only for properties and metrics with numerical values (integer, real, or money). |
and then click Chart view.
 to further configure the chart. You can change the chart type, the chart display, and set chart filters. The chart settings appear below the chart view. Changes will be directly shown in the chart.

To delete a generated chart, click the in the upper right corner of the chart view. To save the chart, click the .
You can add multiple charts to the view by generating a new one based on another object property. The charts will be placed below each other.
The following chart types can be selected for displaying data in a generated chart view:
|
Pie |
|
|
Gauge |
|
|
Pie advanced |
|
|
Pie grid |
|
|
Horizontal bar |
|
|
Vertical bar |
|
|
Treemap |
|
|
Scorecard |
|
The following options can be used to change the display of a generated chart view. Their availability depends on the chosen chart type.
|
Show labels |
Shows labels with the element names. |
|
Show tooltips |
Shows tooltips with values when hovering the sections of the chart. |
|
Show legend |
Shows a legend next to the chart, displaying the element names. |
|
Doughnut |
Shows the pie chart a ring shape. |
|
Explode slices |
Shows the pie chart with its slices sized to the value. |
|
Show x axis |
Shows the values of the x axis in a bar chart. |
|
Show y axis |
Shows the values of the y axis in a bar chart. |
|
Show axis |
Shows the values of the axis in the gauge chart. |
|
Angle span |
Sets the span of the angle of the gauge chart, expressed in degrees (max 360). Example values 240 (default), 180, and 90:
|
|
Start angle |
Rotates the gauge chart to change the starting point. The starting point is expressed in degrees. Negative values are possible. Example values -120 (default), 0, and 180:
|
The following options are available for filtering data in a generated chart view.
|
Show all |
Shows all available values in the chart. Default setting. Example:
|
|
Show top |
Shows the upper X values in the chart. Set the value for X. Example show top 4:
Take note that the colors of the shown values may be different from the corresponding values in the default chart above, they are automatically assigned. |
|
Show bottom |
Shows the lowest X values in the chart. Set the value for X. Example show bottom 4:
Take note that the colors of the shown values may be different from the corresponding values in the default chart above, they are automatically assigned. |
A table view shows the values of selected properties and/or metrics for all objects and relations in the active view. To generate a table view, follow these steps:
, and then click Table view.
 , and click Table view again. The property or metric is added to the data table as an additional column.

To delete a table view, click the in the upper right corner of the view. A table view cannot be saved.
To view the details of an item in the table, click its row. The row will be highlighted, and the element's Properties panel will be shown.
The display of a generated table view can be changed by changing the number of rows that must be shown, filtering the values, or sorting them. Please note that these display options are not persistent; they will not be saved when the table view is saved as a viewpoint or when the view with the generated table view is shared.
To change the number of rows that must be shown, click the Show rows button, and select the desired number of rows. If more records rows are available than rows are shown, navigation controls will appear at the bottom of the table view.

Data in a generated table view can be filtered by typing values in one or more of the filter boxes at the top of the table. The data is automatically filtered. To filter the data in all columns, use the top box Filter all columns. To filter data in a specific column, use the filter box at the top of a column.

The default sorting of the data in the table is set by the order in which the objects are added to the table by Horizzon. To change the table sorting, click a column title. The column will be sorted in ascending order. Click again to sort descending.

By default, a generated view remains open until it is closed. Once you navigate to another page, it is lost. To prevent this, you can save the generated view as a viewpoint by pinning it. A pinned viewpoint is saved and preserved across multiple Horizzon sessions until the pin is removed again.
Pinned viewpoints are user-based, meaning they are only visible to the user who created them, not to other users. Each user can pin their viewpoints. All generated views can be pinned, except highlight views. Highlight views can be generated again in a saved color view.
To pin a viewpoint, click the in the view's lower or upper right corner. Once the view is pinned, the control turns blue  . To unpin, click the blue pin again. When you leave the page, the viewpoint will not be preserved.
To delete a viewpoint while staying on the page, click the next to the pin.

Viewpoints can also be created on explorations. You can do this on saved explorations, as well as while still exploring objects. In both situations, pinning a viewpoint will store it with the exploration. Creating viewpoints while exploring objects, pinning the viewpoints, and then saving the exploration will preserve the viewpoints. When revisiting the saved exploration, the viewpoints will automatically be applied.
When creating a viewpoint while exploring, the viewpoint will automatically update. If you continue exploring in a saved exploration with a pinned viewpoint, the exploration will not automatically update. You will need to remove the viewpoint and recreate it based on the then-available content.
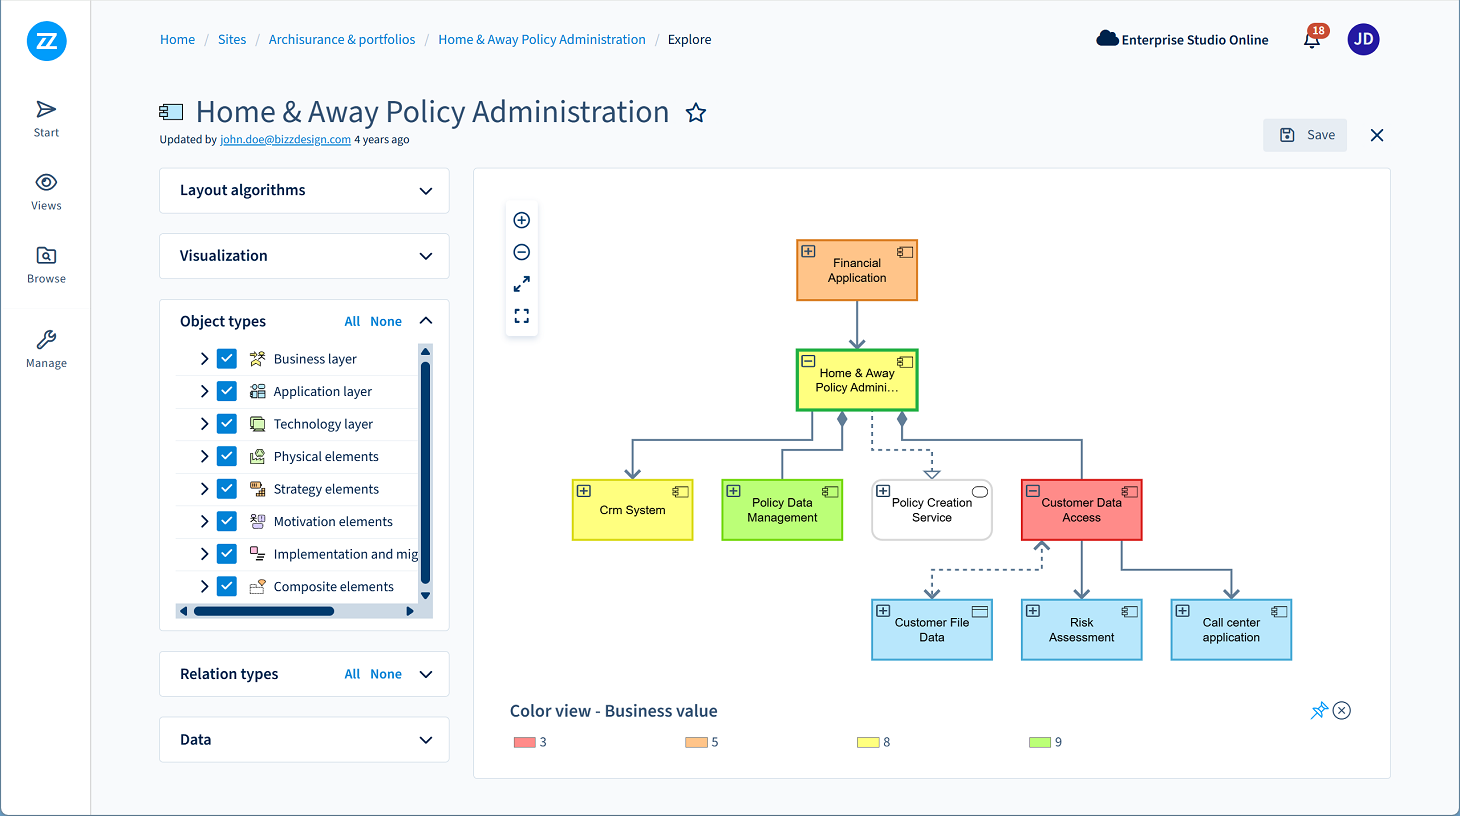
Example of a viewpoint created while exploring objects
Creating viewpoints in Enterprise Studio and in Horizzon are separate processes, and the viewpoints cannot be exchanged. If you need identical viewpoints of a view in Horizzon and Enterprise Studio, you need to generate it in Horizzon and in Enterprise Studio.

Example of a color view in Enterprise Studio (left) and the same color view generated in Horizzon (right)
Views with an active viewpoint can be shared internally with other Horizzon users and with other people outside of Horizzon. The following sharing options are available:
Sharing views with active viewpoints outside of Horizzon via embedding is not supported.


